You may recall some excitement in Chapel Hill in December of 2008 when there was a reported cougar sighting near the UNC golf course. Like many cougar sightings in North Carolina, this one was not confirmed by state wildlife officials. But cougars are on the move eastward from the Rockies and are likely to return to the area some day. The question is when? Common Science is here to try to answer that question.
The discussion of cougars gets complicated by the many names given to the species including puma, mountain lion, and catamount. They are all the same. Prior to European colonization, cougars ranged through most of the United States and Canada, feeding primarily on deer, elk, and moose. Cougars, males in particular, are solitary, territorial, and nocturnal. Their maximum population densities average only four cougars for every 40 square miles, or 0.1 per square mile, a number to which we will refer back later. Therefore, even when cougars are at their normal population densities, sightings are usually rare.
When U.S. and Canadian settlers pushed westward, they considered the cougar to be a menace and a nuisance and killed them indiscriminately. Additionally, even though the losses of livestock were statistically low, farmers and ranchers successfully lobbied their respective state governments to pay bounties for dead cougars. By the 1950s, with the exception of a an isolated population in the Florida Everglades, all cougars east of the Mississippi river had been eliminated and the population between the Mississippi and the Rocky Mountains was nearly wiped out as well. By the 1960s and 1970s, most states repealed the bounties and imposed regulations against indiscriminate killing of cougars, allowing the populations to begin a slow rebound. At present, it is estimated that the cougar population in the U.S. is somewhere between 30,000 and 50,000.
The vanguard of a cougar migration consists of juvenile males who need to find available territories to avoid conflicts with older males. Occasionally a lone male will travel hundreds of miles out of range, which accounts for the infrequent but intriguing reports of cougars along the eastern seaboard, including a recent confirmed sighting in Connecticut. However, the re-establishment of a stable population in a new area must await the arrival of both genders. The eastward migration of the cougar is being tracked via confirmed sightings in midwest states, including Oklahoma, Missouri, Illinois, and Arkansas. Cougar sightings in these states grew from just two in 1990 to 34 in 2008, suggesting a noteworthy increase in population density during this time interval.
This brings me to the reason I find the phenomena of animal migrations to be interesting, and which will usher in the section of this column which is almost certain to differentiate it from any other column you encounter covering the return of the cougar to the eastern United States. The movement of animal populations can be modeled with diffusion equations, a tool often used by engineers like me. Diffusion equations are used to determine the rate of movement of materials from an area of high concentration to one of low concentration. If you’d like to run your own diffusion experiment, put a drop of food dye into a glass of water and watch. Initially, the area where the drop landed will have high concentration of dye. With time, molecules of the dye will migrate away from the area of high concentration to zones of water in the glass which have low or no concentration of dye.
The dynamics of this simple kitchen experiment have a lengthy and elegant mathematical explanation which culminates in Fick’s Law of Diffusion. I’m tempted to include a thorough explanation of the underlying mathematics of Fick’s Law, but I’m not so sure you’d be tempted to read it. What I would like you to consider however, is that the migration of the cougar and the diffusion of the food dye are quite similar. In the case of the cougars, the area near the Rocky Mountains which contains 0.1 cougars per square mile is like the drop of food dye, and the area bereft of cougars east of the Rockies is like the rest of the water in the glass. Therefore, we can use Fick’s Law to try to predict when the cougar will return to the southern part of heaven.
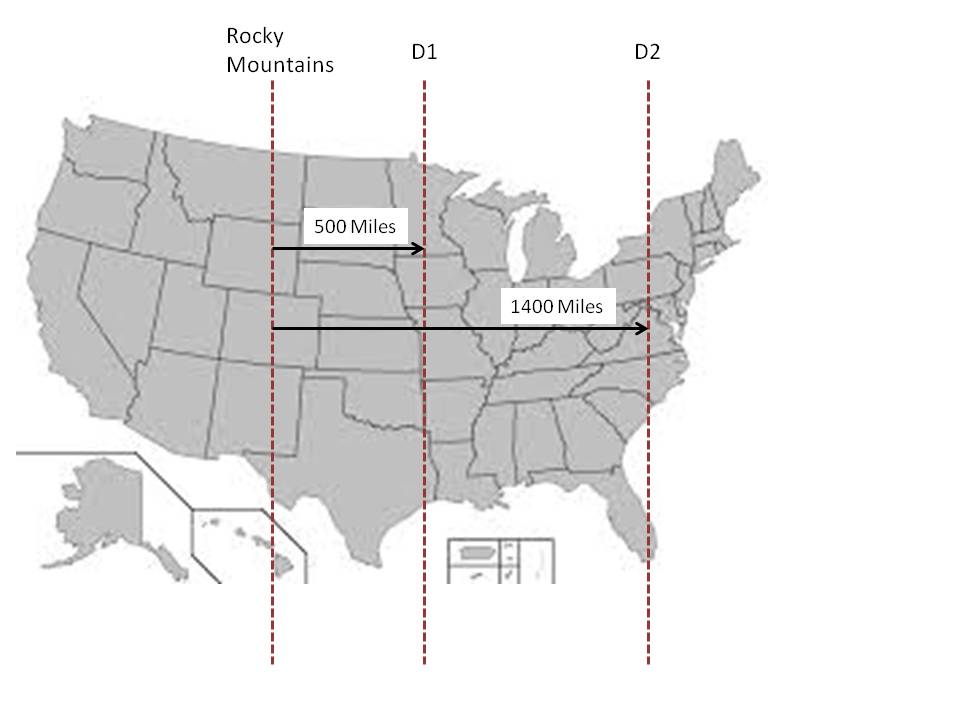
If you look at the map below, the western most dashed line runs approximately along the north-south axis of the Rocky Mountains. About 500 miles to the east, shown by the vertical dashed line called D1 (distance 1), the cougar population density was such that there were just 2 sightings in 1990. We don’t know the exact population density of cougars along D1 in 1990, but we know it was low. In my calculations, I assigned it a value of 0.002 cougars per square mile. I can’t know if this is correct, but as long as I am consistent with the assumption that a population density of 0.002 cougars per square mile will result in 2 sightings per year, the subsequent predictions will still work. (I need you to trust me on that one.) The line D2 on the map indicates the location of Chapel Hill, which is approximately 1400 miles east of the Rockies.
Now that I have the population density of cougars for two locations in 1990, the Rockies and the line D1, I can model the population density of cougars as a function of distance using Fick’s Law. This is shown by the blue line on the graph below. By 2008, the number of sightings in the D1 area rose to 34 per year. Since sightings increased by a factor of 17, from 2 to 34, it is reasonable to assume that the population density increased by a factor of 17 as well. Using this assumption, the population density as a function of distance for 2008 is shown with the purple line. The curve for 2008 suggests that by this time cougars should have begun recapturing western Tennessee as part of their range. News reports conflict as usual, but there is strong anecdotal evidence that they did return to the Volunteer State around that time.
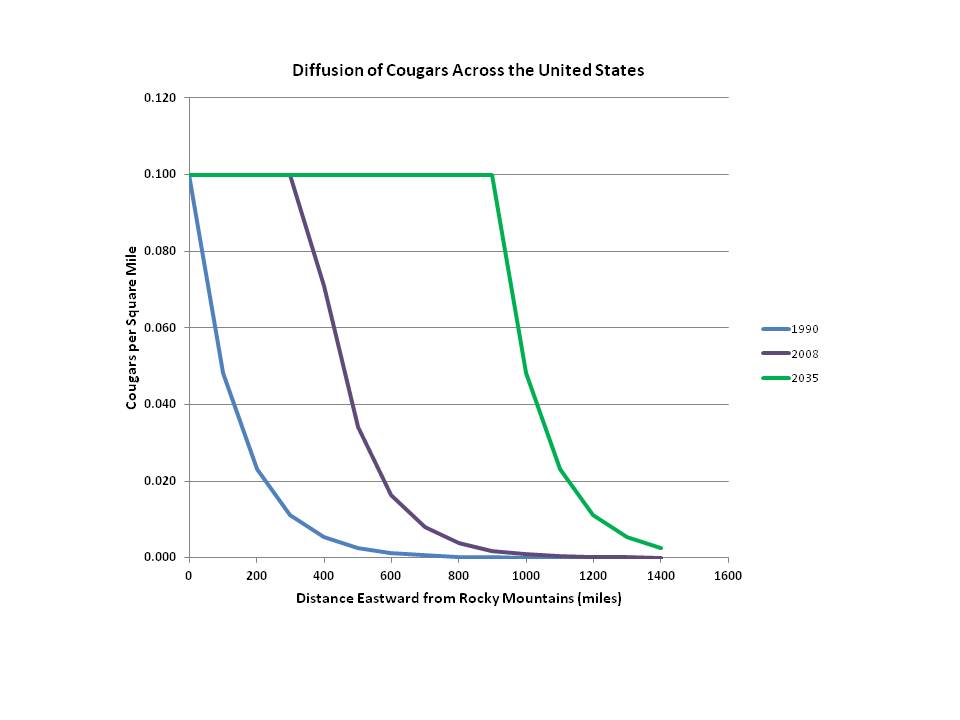 Using this model, I can calculate how long it should take for the population density in Chapel Hill to reach 0.002 cougars per square mile, the level at which we could expected to begin to see confirmed sightings from a resident population consisting of both males and females. This is shown on the graph with the green line, suggesting that in addition to jaguars, tigers, and wildcats (our high school mascots in case you missed the reference), Chapel Hill will have cougars in 2035. If we ever need to build a fourth High School, then the choice for a mascot is obvious.
Have a comment or question? Use the interface below or send me an email to commonscience@chapelboro.com.
